The difference between headphones that sound musical and those that sound clinical often comes down to a few specific bumps and dips in a frequency response graph that most people ignore completely.
After years of obsessively buying, using and comparing audio gear, I have learned that frequency response graphs tell the real story about how headphones will sound. Marketing descriptions like warm, bright, or neutral mean different things to different companies, but a frequency response measurement shows exactly what the drivers are doing across the audible spectrum.
This guide breaks down how to read these graphs properly, what the important regions mean for different types of listening, and which measurements matter most when choosing headphones for your specific needs.
Understanding the Basic Graph Layout
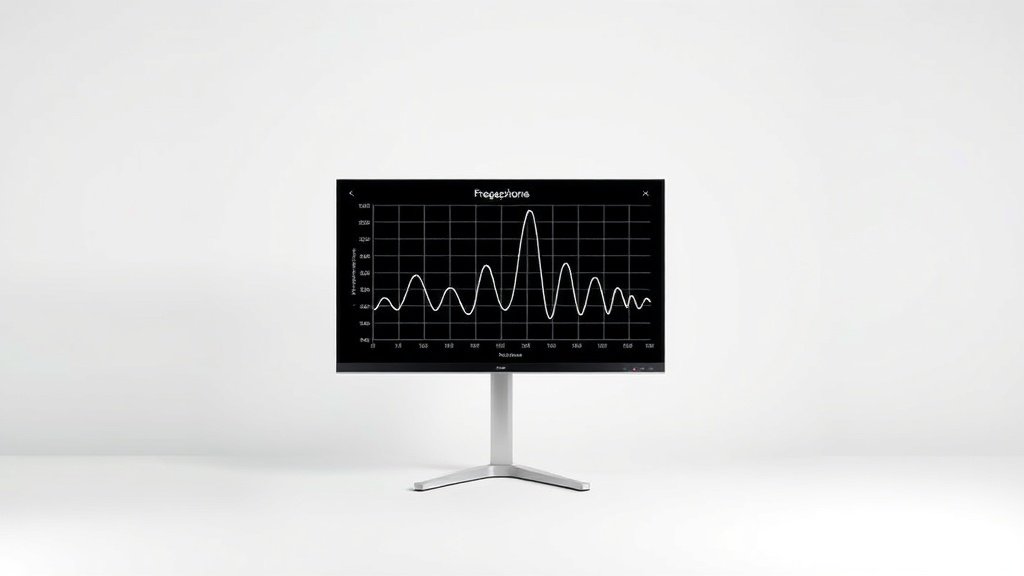
Frequency response graphs plot frequency on the horizontal axis from 20Hz to 20kHz, with amplitude measured in decibels on the vertical axis. The centre line typically represents 0dB, though some manufacturers use different reference points. A perfectly flat line would mean the headphones reproduce all frequencies at exactly the same level, but this rarely sounds natural to human ears.
The graph shows three main regions that correspond to bass, midrange, and treble. Bass frequencies run from 20Hz to roughly 250Hz, midrange covers 250Hz to 4kHz, and treble extends from 4kHz to 20kHz. Each region affects different aspects of music reproduction, from the weight of kick drums in the bass to the airiness of cymbals in the treble.
Most headphones show some deviation from flat response, and these deviations create the sonic character. A rise in the bass region makes headphones sound warmer and more impactful, while a dip in the upper midrange can make vocals sound recessed. Learning to spot these patterns helps predict how headphones will sound before you put them on.
Reading the Bass Region Properly
Bass response below 100Hz determines how much weight and impact the headphones deliver. Open-back headphones like the Sennheiser HD800S typically show a gentle roll-off below 60Hz because they cannot maintain low-frequency pressure without a sealed chamber. Closed-back models like the Focal Stellia can extend deeper with more authority, showing flatter response down to 20Hz.
The shape of the bass curve matters more than absolute extension. A gradual slope from 100Hz down to 20Hz sounds more natural than a sharp drop-off at 50Hz. Some headphones show a deliberate boost around 60-80Hz to compensate for the natural roll-off, but too much emphasis here creates bloated, muddy bass that overwhelms other frequencies.
Planar magnetic headphones like the Audeze LCD-X often show excellent bass extension with tight control, visible as a relatively flat line down to very low frequencies. This translates to clean, articulate low end that does not smear into the midrange frequencies above.
The midrange region between 1kHz and 3kHz contains most of the fundamental information that makes vocals and instruments sound present and clear.
Interpreting Midrange Response
Midrange response determines how forward or recessed vocals and instruments sound in the mix. The presence region around 2-3kHz is particularly critical because human hearing is most sensitive here. A boost in this area makes headphones sound more immediate and detailed, while a dip creates a more laid-back presentation that some find more comfortable for long listening sessions.
Many headphones follow the Harman target curve, which includes a gentle rise through the midrange to match how we hear sound in natural environments. The Audio-Technica ATH-M50x shows a noticeable presence boost that makes it popular for monitoring applications, while the Beyerdynamic DT770 Pro has a more relaxed midrange that works well for extended listening.
Watch for sharp peaks or notches in the midrange, as these create obvious coloration. A narrow spike around 3kHz can make voices sound shouty, while a deep notch around 1kHz pushes fundamental frequencies back in the mix. Smooth, gradual changes generally sound more natural than abrupt transitions between frequencies.
Decoding Treble Response
Treble response above 4kHz affects the sense of air, detail, and spaciousness in recordings. Most headphones show some irregularity in this region due to the complex interactions between the driver, ear cup acoustics, and measurement setup. Small peaks and dips are normal, but large deviations create obvious tonal shifts.
A peak around 6-8kHz can add perceived detail and clarity but may become fatiguing during long sessions. The Grado SR325x deliberately emphasises this region to create its signature detailed sound, while the Audeze LCD-2 takes a more conservative approach with gentler treble that prioritises smoothness over aggressive detail.
The extreme treble above 10kHz contributes to the sense of openness and air around instruments. A sharp roll-off here makes headphones sound closed-in, while too much energy can create harshness. The measurement becomes less reliable at these frequencies due to positioning sensitivity, so focus more on the overall trend than specific peaks.
Comparing Measurements Between Sources
Different measurement systems produce different results, so compare graphs only when they come from the same source using identical methods. Measurements from Audio Science Review use a standardised GRAS system that provides consistent results, while manufacturer measurements often use proprietary setups that may flatter their products.
Pay attention to the measurement conditions and target curve used. Some sources show raw measurements, while others compensate for ear canal acoustics or apply smoothing that hides detail. Rtings.com provides comprehensive measurements with multiple target curves, making it easier to understand how different headphones compare across various preferences.
The measurement setup affects results significantly, especially in the treble region where small positioning changes create large differences. This explains why the same headphones can show different high-frequency response on different measurement rigs, even when both systems are accurate.
Assuming perfectly flat response always sounds best. Human hearing evolved in acoustic environments with natural reflections and resonances, so some deviation from flat often sounds more realistic and engaging than mathematically perfect response.
Focusing only on frequency response while ignoring other measurements. Distortion, impedance, and sensitivity measurements provide important context that affects real-world performance, especially when choosing amplification or assessing long-term listening comfort.
Comparing measurements from different sources without understanding methodology differences. Each measurement system has unique characteristics and limitations, so graphs from different sources cannot be directly compared even for identical headphones.
Conclusion
Reading frequency response graphs effectively requires understanding what each region contributes to the overall sound and how your personal preferences align with different response patterns. Focus on the overall shape and trends rather than minor irregularities, and always consider measurements alongside other specifications and real-world listening when making decisions.

FREE DOWNLOAD
Stop Guessing. Start Buying Smart.
The specs that actually matter, demystified.
Headphones, microphones, the spec sheet jargon you can ignore — all in one quick-reference PDF. Free, instant, no fluff.
Send Me the CheatsheetYou'll also receive occasional new guide notifications. Unsubscribe anytime. No spam, ever.